The Benefits of Understanding your Track Geometry Measurements
12 February 2019Table of Contents
The Goal
The overall goal of track maintenance is to deliver the track, to support the timetable. This is achieved by Rail and Transit owner-operators through four objectives. First, to deliver safety to all passengers and staff, safety for passengers who depend on the rail system. Second, to deliver a reliable rail system, to ensure that the required services are available and that all assets are fit for purpose. Third, to deliver economic prosperity for a rail organization, through optimal and sustainable maintenance activities; and lastly, to deliver a comfortable ride for the consumer, reducing noise and improving ride quality. To deliver these goals, a rail organization must understand the criticality of all their assets, and the condition, along with the quality of the track they own and operate on.
Linear Measurements
Track Geometry measurements are a key component to understanding if the track is fit for purpose and is in a state of good repair. Periodic track condition measurements are required to evaluate the track quality and maintain an effective railway track system. Today most railroads already collect track geometry measurements from recording vehicles; however, often rail operators are not utilizing the data to its full advantage and sometimes data sets are held in siloed systems; making it almost impossible to visualize different condition data at the same time. Track Geometry contains a wealth of information that can support a range of maintenance and renewal decision support.

Core Track Geometry Measurements and Calculations
Gauge; the distance between the running edge of the left and right rail. There are several gauges used globally, the standard gauge is 1,435 mm (4 ft 8 1⁄2 in) and is typically used in North America and most of Europe. As the linear asset degrades, the distance between the rails will increase. This deterioration can cause a train to derail.
Curvature; one way to survey a track alignment is to measure the offsets from a chord to the running edge of the rail at the centres of successive overlapping chords, laid out along the outer rail of the surveyed track, this offset is called a versine.

Superelevation; is a difference in height between the left and right rails. It is generally applied in curves, with the low rail being on the inside edge of the curve. It is applied to offset the lateral forces that are felt when a vehicle traverses a curve.
Vertical Track Variation; a challenge for some individuals to understand is that the underlying geometry is not important; for example, a hill or a valley was already designed into the system. However, if there is a bump or a dip in the track on a hill, that is the information that is needed for extraction. The hill is viewed as a zero, we want to pay attention to the oscillations or variations in the track geometry data. As a general rule, if it takes less than two seconds to go through the variation at line speed, then we consider the variation; and if it takes more than two seconds, then we don’t consider the variation.

Lateral Track Variation; horizontal track geometry is generally filtered in the same way as vertical track geometry. We are looking for features that can be traversed in less than two seconds at line speed. The two seconds is derived from ISO 2632 – Human Comfort.
Track Twist; the difference in cross-level between two points or the rate of change of superelevation and measured over the impact on the bogie; this should be calculated based on the smallest wheelbase used by the owner-operator. A worst-case scenario is that the front wheel would drop onto a twist causing the rear wheel to climb, resulting in a train derailment.

Core Channels from a Track Geometry System
Location; beyond recording what the track geometry is, the system needs to record where it is as well. This is often one of the main issues with geometry data, as the same feature can be recorded at slightly different locations on different recording runs. Distance measured along the track can be derived from a tachometer fitted to one of the axles. This is a reasonably effective mechanism, but errors can be introduced as the wheel wears and if the recording vehicle runs around curves at different speeds. This can be corrected by GPS where available, or by detecting known features along the network and marking them against the recording. Lastly, the location should be reported against the linear referencing system (LRS) for the track, not against the distance traveled by the recording vehicle.

Speed; the FRA defines the maximum allowable posted timetable operating speed using the Vmax formula. We can take our curve data and plot the max speeds on our track charts. Additionally, we can calculate the equilibrium speed, which is the minimum speed that should be traveled through a curve. If locomotive traverses through the curve above Vmax speed, this causes extra wear on the outside rail; and if the locomotive traverses through the curve below the equilibrium speed, then this causes extra wear on the inside rail. This can be tracked and shown in our track charts with real locomotive speed data, to ensure operators are traversing through curves at the appropriate speed.
By Robert Henderson – Rail and Transit Consultant at Bentley Systems
More from my site
 Railway Viaduct Project Autocad Drawing
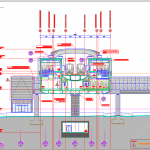 Railway Station Cross Section Autocad DWG File
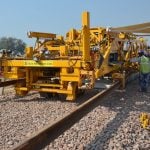 Construction of Railway Track Methods
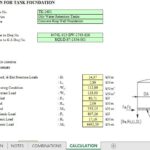 Tank Concrete Ring Wall Foundation Spreadsheet
 Bentley Systems introduces Mixed Reality app for infrastructure construction projects
 Water Retaining Structures Analysis and Design Spreadsheet