Column Interaction Diagrams Spreadsheet
1 May 2022Column Interaction Diagrams Spreadsheet
This spreadsheet is an educational module that shows how axial and flexural stresses are combined to produce a nominal and design strength curve for a rectangular reinforced concrete column.
A detailed explanation of the calculations are given in Columns Example 1. This content of this spreadsheet is separated into several sheets by topic.
To navigate to the different topics. select the tabs at the bottom of the page.
Input fields have a blue background. The rest of the cells in the spreadsheet are locked but the formulas in the cell are visible for the users information. A brief description of the topics are provided below:
Introduction (Sheet 1) – A description of the content of the Column Interaction Diagram Spreadsheet.
Terms of Use (Sheet 2) – The legal terms and condition of use of this Column Interaction Diagram Spreadsheet are stated. All users of this educational material must agree to these terms before using the content herein.
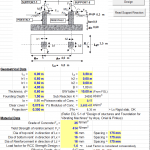
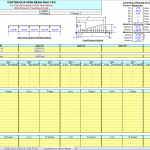
Inputs (Sheet 3) – This spreadsheet analyzes rectangular columns with ties. The analysis is for one axis along the “h” dimension. The number of layers refers to the number of bars in the “h” direction.
Layer 1 is always placed as close as possible to the face of the concrete that creates the greatest value for “d.” If two layers are entered, the next layer is placed as close as possible to the face of the concrete that creates the lowest value for “d: For more than two layers, the additional layers are evenly spaced between the outer layers and numbered in order from the greatest value of “d” to the lowest.
The bar geometry must be symmetrical about the center of the section. The remaining inputs are self explanatory. Note that one value of f,. is used for both the longitudinal and transverse reinforcement.
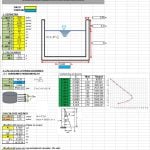
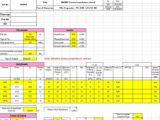
Critical Diagram Points (Sheet 4) – Five key points of the interaction diagram are calculated on this page: pure compression, pure tension, pure bending, balanced point, strain at the extreme tension reinforcement is zero, and strain at the extreme tension reinforcement is half the yield strain. The calculations and descriptions are given.
Select Axial Load (Sheet 5) – This sheet allows the user to input an axial load. The related moment on the interaction diagram is calculated. This is helpful when designing columns in intermediate and special moment frames, where the nominal or probable moment must be determined.
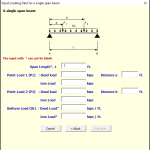
Interaction Diagram Points (Sheet 6) – Calculation of the data points on the interaction diagram are shown on this sheet.
Nominal Diagram (Sheet 7) – The nominal strength interaction diagram is plotted on this sheet. The five critical diagram and input points are also shown.
Design Diagram (Sheet 8) – The design strength interaction diagram is plotted on this sheet. The five critical diagram and input points are also shown.
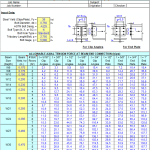
Rebar Database (Sheet 9) – This is a reference sheet that contains a table of reinforcing steel variables used by the formulas throughout the spreadsheet.