Quantitative Risk Analysis
15 March 2019Table of Contents
Quantitative Risk Analysis
This process is the second step in risk assessment. The purpose of this process is to numerically evaluate risks that need additional analysis after performing qualitative analysis. This evaluation is objective and the result is numerical but it depends on calculations and it lacks of human sense. It means that these results tend to be the most accurate if revised by human sense after running the calculations.
1 – Probability Distribution
Quantitative analysis utilizes computer software to model probability distribution. This can be depicted graphically using continuous distribution or discrete distribution.
Figure-1 Shows some types of continuous distribution.
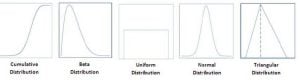
Figure-1 : Continuous distribution
In discrete distribution, data can be represented as bars. Each bar represents a possible outcome and each outcome is assigned a probability. Figure-2 Shows a model of discrete distribution.
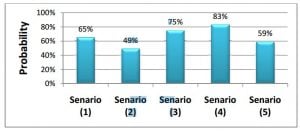
Figure-2 : Discrete Distribution
The difference between continuous and discrete distribution can be following comparison in table-1.
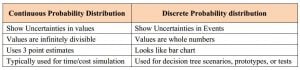
Table-1 : Comparison between continuous and discrete distributions
2- Quantitative and Modeling Techniques
Quantitative analysis utilizes simulation and modeling techniques such as sensitivity analysis, expected monetary value, and Monte Carlo.
2-1 Sensitivity Analysis
This technique shows the range of outcomes for a risk by changing only one element each time (what-if analysis) and measuring its impact. This is being done several times to evaluate the range of outcomes. It’s possible to change multiple elements by designing of experiment (DOE). Table-2 shows an example on sensitivity analysis. A common way to display these results is tornado diagram as shown in figure-3.
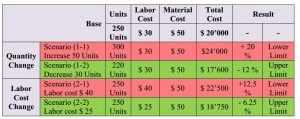
Table-2 : Sensitivity Analysis
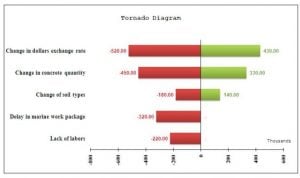
Figure-3 : Tornado Diagram
2 -2 Expected Monetary Value
This technique calculates outcomes considering both probability and impact. It’s used to make decisions after gathering data on two or more alternatives. It depends basically on the impact of each decision and the probability that it may happen.
Multiplying impact by its probability will result the expected monetary value.
Comparing these values will facilitate taking decision. This technique uses the decision tree analysis as a graphical method to represent alternatives and their impact/probability. Figure-4 shows an example of decision tree analysis.
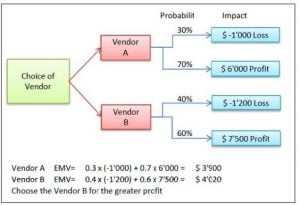
Figure-4 Decision Tree Analysis
2-3 Simulation & Modeling
This technique utilizes Monte Carlo technique as a simulation tool. Project model is computed several times with the input of cost estimates or activity durations that are being choose at random for each time from the probability distributions of these variables. A chart of total cost or total duration is then drawn. Figure-5 shows an example of this chart.
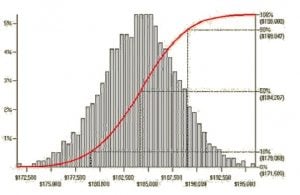
Figure-5 : Monte Carlo Simulation for Project Cost
3 – Risk Register Update
At this point, the risk register will be updated with the followings
1- Probabilistic analysis of the project
2- Quantified probability of meeting project objectives
3- Prioritized list of quantified risks
4- Overall project risk (Risk Exposure)
More from my site
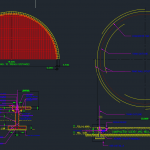
 Concrete Tank Foundation Free Drawing
- Construction Program Management – Decision Making and Optimization Techniques
- Checking safety factor against buoyancy using Buoyancy free software
- Rectangular Column Design and Calculation Spreadsheet
- Dynamic Behavior Of Concrete And Seismic Engineering Free PDF
- SELF-HEALING CONCRETE