How LiDAR is Being Used to Help With Natural Disaster Mapping and Management
10 May 2019Table of Contents
How LiDAR is Being Used to Help With Natural Disaster Mapping and Management
Michael Shillenn, vice president and program manager with Quantum Spatial outlines three projects where LiDAR data from the USGS 3D Elevation Program (3DEP) has been used to assist in planning, disaster response and recovery, and emergency preparedness.
This month the United States Geological Survey (USGS) kicks off the fourth year of its grant process that supports collection high-resolution topographic data using LiDAR under its 3D Elevation Program (3DEP). The 3DEP program stemmed from the growing national need for standards-based 3D representations of natural and constructed above-ground features, and provides valuable data and insights to federal and state agencies, as well as municipalities and other organizations across the U.S. and its territories.
With geospatial data collected through 3DEP, these agencies and organizations can mitigate flood risk, manage infrastructure and construction projects, conserve national resources, mitigate hazards and ensure they are prepared for natural and manmade disasters.
Here’s a look at three projects undertaken by Quantum Spatial Inc. on behalf of various government agencies, explaining how the LiDAR data collected has been used to support hurricane recovery and rebuilding efforts, provide risk assessments for potential flooding and address potential volcanic hazards.
Hurricane Sandy Disaster Response and Recovery
Hurricane Sandy was one of the deadliest and most destructive hurricanes of the 2012 Atlantic hurricane season, impacting 24 states, including the entire Eastern seaboard from Florida to Maine. The Disaster Relief Appropriations Act of 2013 enabled the USGS and National Oceanic and Atmospheric Administration (NOAA) to support response, recovery and mitigation of damages caused by Hurricane Sandy.
As a result, USGS and NOAA coordinated the collection of high-resolution topographic and bathymetric elevation data using LiDAR technology along the eastern seaboard from South Carolina to Rhode Island covering coastal and inland areas impacted by the storm. This integrated data is supporting scientific studies related to:
- Hurricane recovery and rebuilding activities;
- Vulnerability assessments of shorelines to coastal change hazards, such as severe storms, sea-level rise, and shoreline erosion and retreat;
- Validation of storm-surge inundation predictions over urban areas;
- Watershed planning and resource management; and
- Ecological assessments.
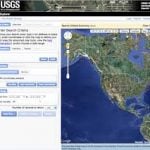
The elevation data collected during this project has been included in the 3DEP repository, as well as NOAA’s Digital Coast — a centralized, user-friendly and cost-effective information repository developed by the NOAA Office for Coastal Management for the coastal managers, planners, decision-makers, and technical users who are charged to manage the nation’s coastal and ocean resources to sustain vibrant coastal communities and economies.
In this image, you’ll see a 3D LiDAR surface model colored by elevation centered on the inlet between Bear and Browns Island, part of North Carolina’s barrier islands south of Emerald Isle in Onslow Bay. The Back Bay marshlands and Intercostal Waterway also are clearly defined in this data.

3D LiDAR surface model colored by elevation centered on the inlet between Bear and Browns Island, part of North Carolina’s barrier islands south of Emerald Isle in Onslow Bay.
Flood Mapping and Border Security along the Rio Grande River
Not only is flooding one of the most common and costly disasters, flood risk also can change over time as a result of development, weather patterns and other factors. The Federal Emergency Management Agency (FEMA) works with federal, state, tribal and local partners across the nation to identify and reduce flood risk through the Risk Mapping, Assessment and Planning (Risk MAP) program. Risk MAP leverages 3DEP elevation data to create high-quality flood maps and models. The program also provides information and tools that help authorities better assess potential risk from flooding and supports planning and outreach to communities in order to help them take action to reduce (or mitigate) flood risk.
This image depicts a 3D LiDAR surface model, colored by elevation, for a portion of the City of El Paso, Texas. U.S. and Mexico territory, separated by the Rio Grande River, is shown. Centered in the picture is the Cordova Point of Entry Bridge crossing the Rio Grande. The US Customs and Border Protection, El Paso Port of Entry Station is prominently shown on the north side of the bridge. Not only does this data show the neighborhoods and businesses that could be impacted by flooding, but also it provides up-to-date geospatial data that may be valuable to border security initiatives.

3D LiDAR surface model, colored by elevation, for a portion of the City of El Paso, Texas. U.S. and Mexico territory, separated by the Rio Grande River
Disaster Preparedness Around the Glacier Peak Volcano
The USGS has a Volcano Hazards Program designed to advance the scientific understanding of volcanic processes and lessen the harmful impacts of volcanic activity. This program monitors active and potentially active volcanoes, assesses their hazards, responds to volcanic crises and conducts research on how volcanoes work.
Through 3DEP, USGS acquired LiDAR of Glacier Peak, the most remote, and one of the most active volcanoes, in the state of Washington. The terrain information provided by LiDAR enables scientists to get accurate view of the land, even in remote, heavily forested areas. This data helps researchers examine past eruptions, prepare for future volcanic activity and determine the best locations for installing real-time monitoring systems. The LiDAR data also is used in the design of a real-time monitoring network at Glacier Peak in preparation for installation in subsequent years, at which time the USGS will be able to better monitor activity and forecast eruptions.
This image offers a view looking southeast at Glacier and Kennedy Peaks and was created from the gridded LiDAR surface, colored by elevation.

3D LiDAR surface model of a view looking southeast at Glacier and Kennedy Peaks.
Source : www.gislounge.com